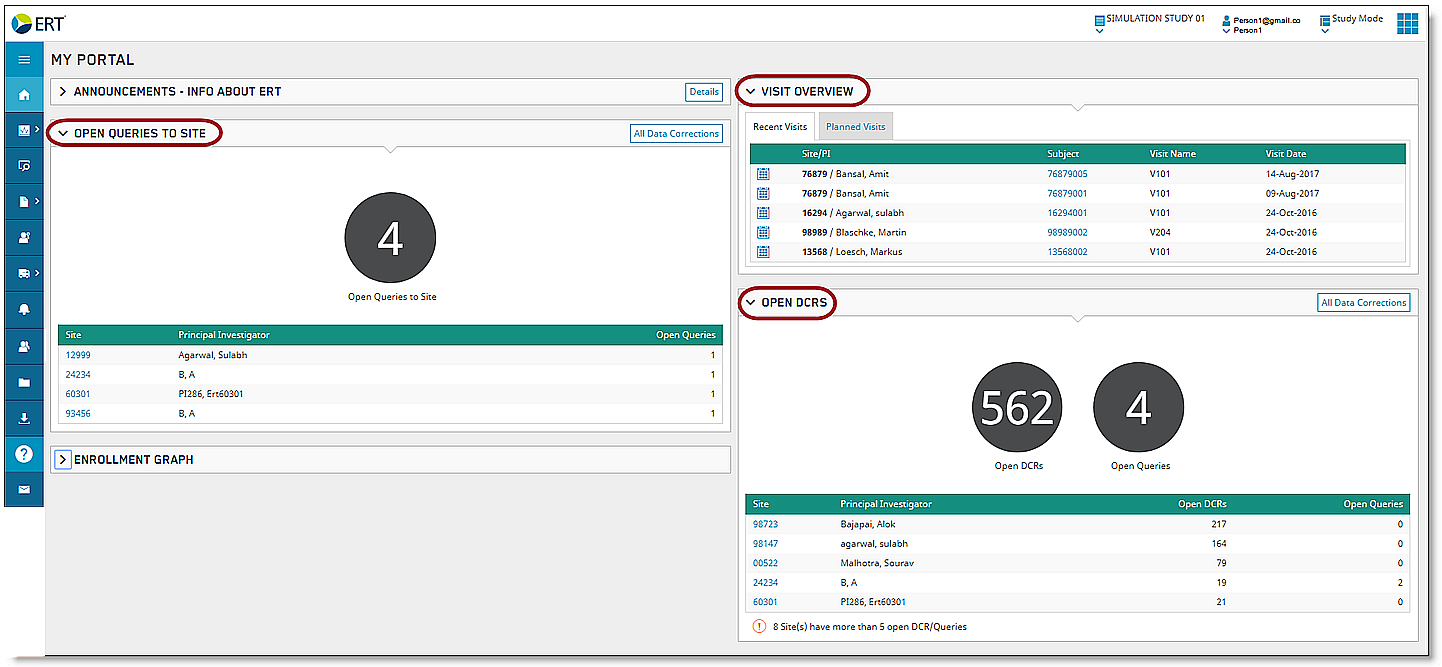
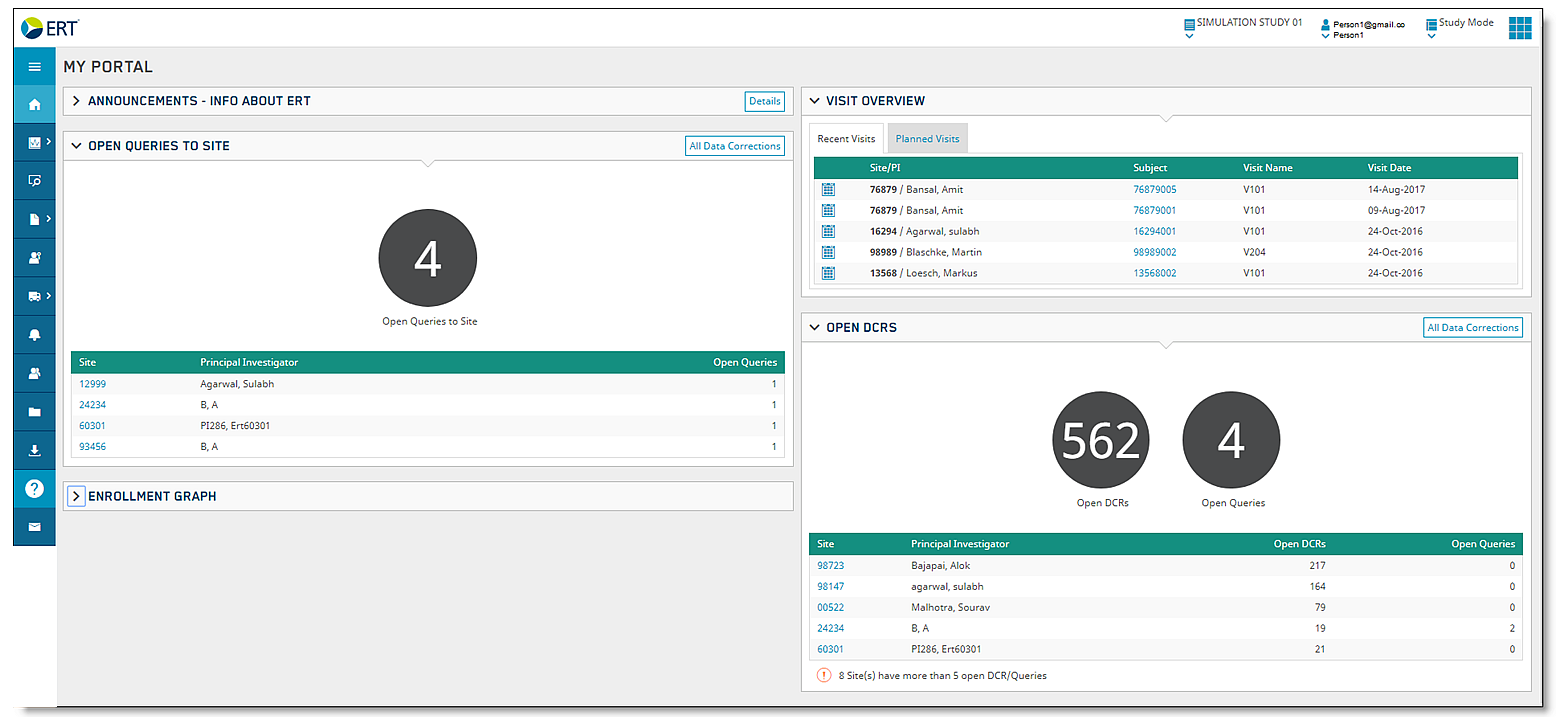
The ERT Portal Dashboard displays the following information:
Navigation icons on the left side of the window represent sections of the Portal that you can access. The icons you see depend on your type of access and differ from user to user.
Widgets on the right side of the window represent quick views of study information; for example, the figure on the right shows Visit Overview, Open Queries to Site, and Open DCRs.
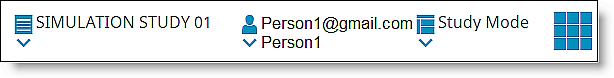
Title Bar information at the top of the window contains the Protocol Name ("Simulation Study 01" in this example), the User Name ("Person 01" in this example), and the Study Mode.
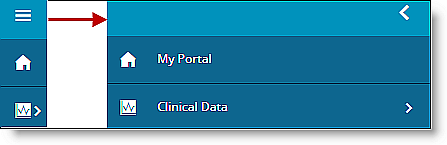
To view which areas of the Portal the icons represent, click the Display icon. A panel slides to the right displaying the sections.
To access the Help section from the Dashboard, click the Question Mark icon.
The Title Bar is described in the ERT Global Account help
Widgets may include the following:
Announcements
Open DCRs
Open Queries
Visit Overview
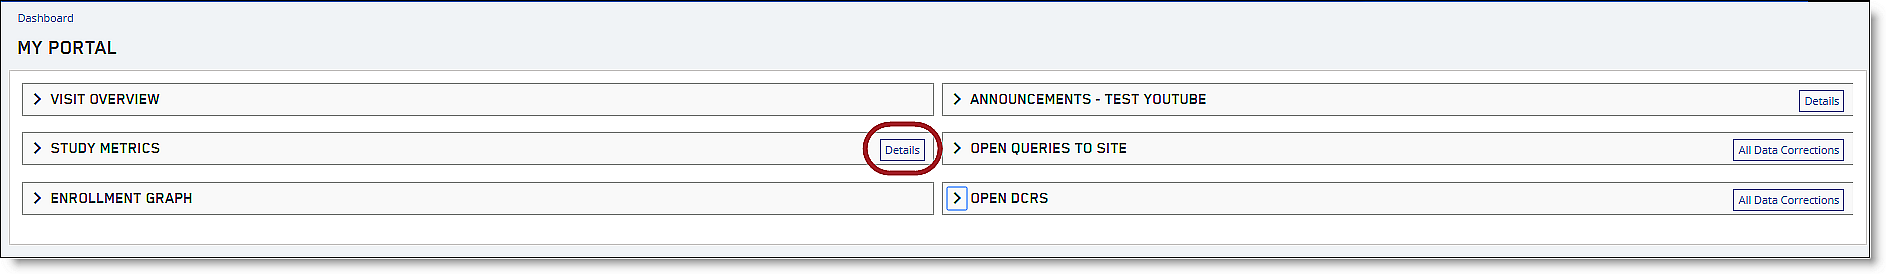
Study Metrics
Enrollment Graph
|
The Widgets that show on the Dashboard may differ depending on study type and the Portal user’s access level. |
Click the Open/Close icon to minimize an expanded widget window, and to expand a minimized widget. Widgets may be minimized and maximized as desired. See the example to the right for the view with all widgets minimized.